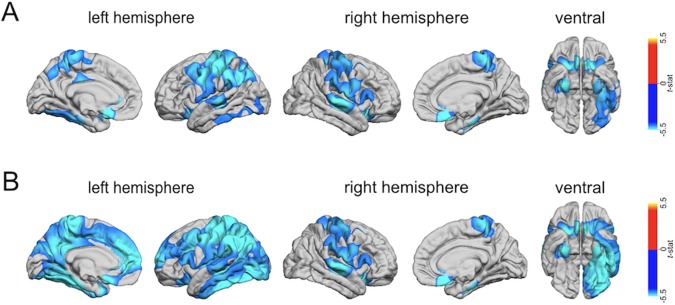
Figure 3.

Clusters with significantly decreased grey (GMI) or white (WMI) matter tissue intensity in DS compared to TD controls (RFT‐based cluster corrected, p < .001, two‐tailed), sampled at (a) 1.0 mm into the white matter starting from the grey–white matter boundary for WMI (upper panel), and measured at (b) 30% into the thickness of the cortical ribbon from the pial surface for GMI (lower panel)
