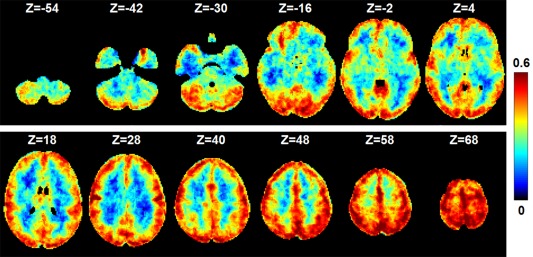
Figure 4.

The performance of the trained sRBM model in the representation of input fMRI data. The map shows the Pearson correlation coefficients between the reconstructed and input fMRI signals in HCP Motor task. We calculated the Pearson correlation coefficient between the reconstructed fMRI signal and the original fMRI signal for each voxel. The correlation maps were averaged over the 20 subjects [Color figure can be viewed at http://wileyonlinelibrary.com]
