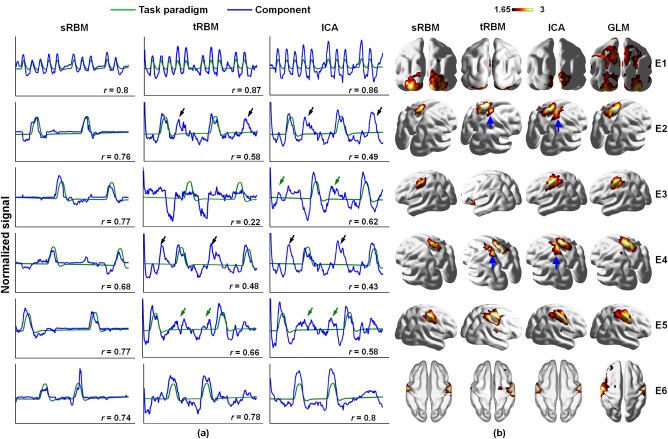
Figure 5.

Comparison of TCs (a) and SMs (b) of task‐related components between sRBM, tRBM, and ICA in HCP Motor task. r is the Pearson correlation coefficient between the task‐related TC and the task paradigm in each event. The black and green arrows highlight intermixed effects in TCs. The blue arrows highlight false‐positive activations in SMs in tRBM and ICA [Color figure can be viewed at http://wileyonlinelibrary.com]
