
Figure 4.
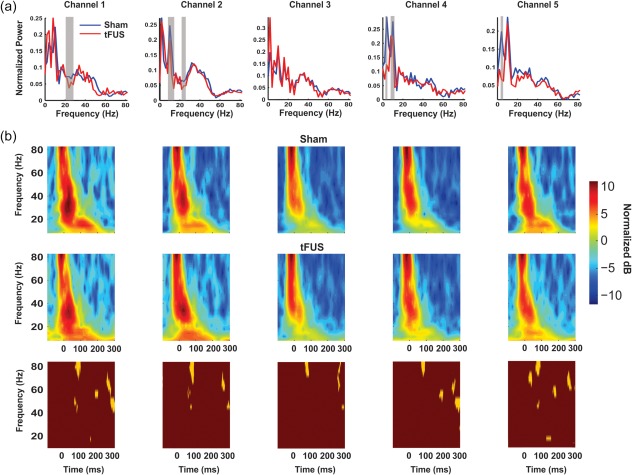
Group average frequency spectra. (a) Group mean (n = 20) FFT frequency spectra for EEG time window 10–300 ms post MN stimulation. Vertical grey bars denote time widows that met statistical significance (p < .05 corrected). (b) Group mean pseudocolor (n = 20) Morlet wavelet time–frequency spectra in decibels (dB) relative to a prestimulus baseline. Top row is Sham stimulation and middle row is ultrasound (tFUS) stimulation. Gold and maroon boxes (bottom row) are statistical maps of time–frequency data; gold areas met statistical significance (p < .05 corrected)