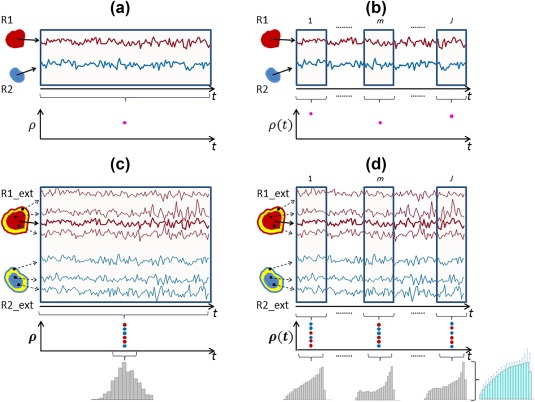
Figure 2.

Schematic of four different classes of functional connectivity. R1 and R2 denote two distinct nodes, while R1_ext and R2_ext denote the same two nodes in addition to their spatial neighborhoods (shown in yellow). (a) Class I – Static in both time and space, in which case, regionally‐averaged time courses were correlated to yield a single correlation value. (b) Class II – Static in space, dynamic in time; in this class, correlations were defined between windowed time courses from the two regions. (c) Class III – Dynamic in space, static in time, where a histogram of correlations was obtained by correlating the seed time course with individual voxel time courses from nodes as well as their neighborhood (d) Class IV – Dynamic in both space and time, where a histogram of correlations was defined from each sliding window [Color figure can be viewed at http://wileyonlinelibrary.com]
