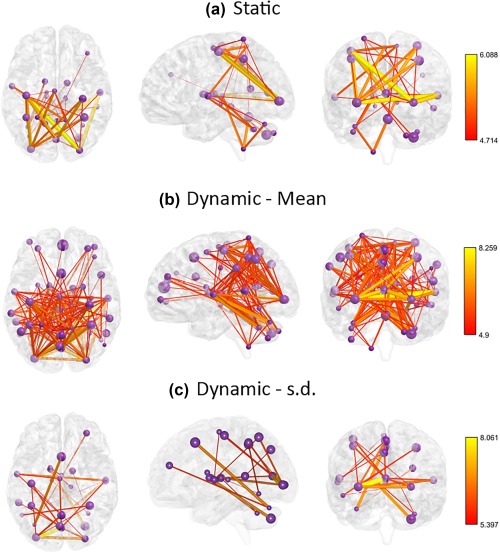
Figure 7.

Static and dynamic connections those are significantly different between control and patient groups. (a) Connections that are significantly different for Class I: Static in space and time. (b) Connections for which mean strength is significantly different for Class II: Static in space and dynamic in time. (c) Connections for which variability is significantly different for Class II. Compared to Class I, Class II comprises more connections that are significantly different between the two groups. Purple spheres represent the network nodes, with the size of each sphere scaled according to the spatial volume of the corresponding node. The colour and thickness of each connection represents the t statistic, as per the color bars. s.d. – standard deviation. BrainNet Viewer (Xia, Wang, & He, 2013) was used to visualize these connections [Color figure can be viewed at http://wileyonlinelibrary.com]
