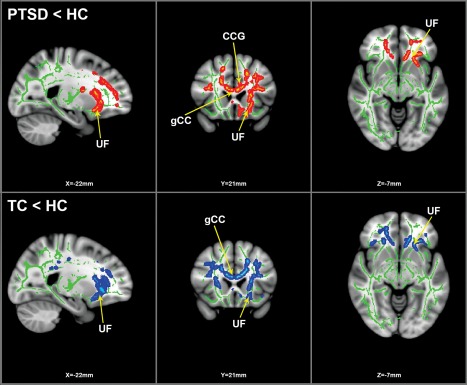
Figure 1.

TBSS analysis results: group difference depicting FA reductions. Statistically significant clusters of FA reductions calculated using 25 (13F/12M) PTSD subjects, 25 (13F/12M) HC and 25 (13F/12M) TC. Top panel depicts PTSD versus HC whole‐brain analysis; red/orange indicates significant clusters of voxels (FWE corrected for multiple comparisons at p < .05, k > 10 voxels) with reduced FA values in PTSD compared to HC. Bottom panel depicts TC versus HC whole‐brain analysis; blue indicates significant clusters of voxels (FWE corrected, p < .05, k > 10 voxels) with reduced FA values in TC compared to HC. Green indicates FA skeleton. FA reduction clusters rendered on standard MNI152 structural template. Images are radiologically oriented. Abbreviations are as follows: HC = healthy controls; TC = trauma controls; FA = fractional anisotropy; CCG = cingulum cingulate gyrus; gCC = genu corpus callosum; UF = uncinate fasciculus
