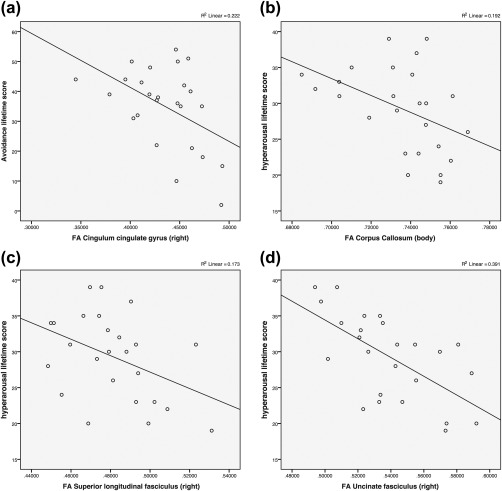
Figure 2.

Correlations between CAPS subscores and fractional anisotropy (FA) values of the PTSD subject group. Scatterplots illustrating the association between CAPS subscore (a) lifetime avoidance and right cingulum cingulate gyrus FA (r(23) = −.471, p = .017); (b) lifetime hyperarousal and corpus callosum body FA r(23) = −.438, p = .028; (c) lifetime hyperarousal and superior longitudinal fasciculus FA (r(23) = −.416, p = .039); (d) lifetime hyperarousal and right uncinate fasciculus FA (r(23) = −.625, p = .001)
