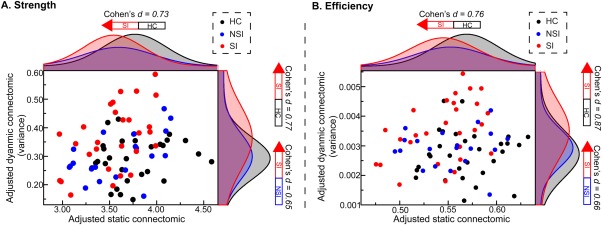
Figure 3.

Distribution of topological properties in static and dynamic connectomics. The horizontal and vertical axes represent the overall topological properties of static connectomics and the variability of overall topological properties of dynamic connectomics (adjusted by age, sex, education, and mean FD), respectively. Black, blue, and red dots and lines represent the HC, NSI, and SI groups, respectively. Abbreviations: FD = framewise‐displacement; HC = healthy control; NSI = major depressive disorder without suicidal ideation; SI = major depressive disorder with suicidal ideation [Color figure can be viewed at http://wileyonlinelibrary.com]
