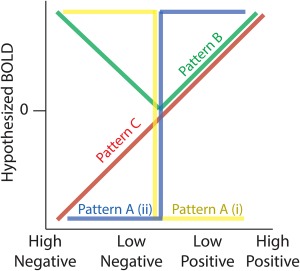
Figure 1.

Hypothesized profiles for BOLD responses as function of the three RPE components. Pattern A (i and ii) describe the two categorical valence responses (yellow and blue colours indicate (i) responses being greater for negative compared with positive outcomes [NEG > POS] and (ii) responses being greater for positive compared with negative outcomes [POS > NEG]). Pattern B captures surprise effects with greater responses for higher outcome deviations from expectations, independent of the sign (valence) of the RPE. Pattern C shows a monotonically increasing response profile consistent with a signed RPE representation [Color figure can be viewed at http://wileyonlinelibrary.com]
