
Figure 3.
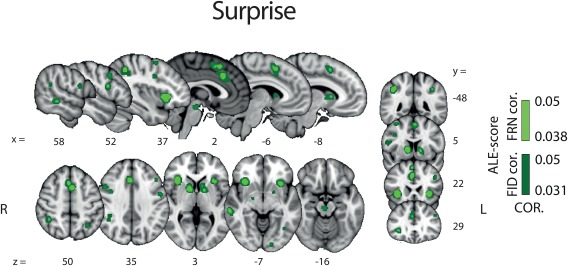
Results of the whole brain ALE analysis for the surprise component of RPE (pattern B, Figure 1). Overlay of brain areas activated by all analyses representing direct or indirect measures of the surprise component of RPE (p values corrected with FDR‐ID [FID] and FDR‐pN [FRN] < .05 and a minimum cluster volume of 50 mm3). Representative slices are shown with MNI coordinates given below each image [Color figure can be viewed at http://wileyonlinelibrary.com]