
Figure 7.
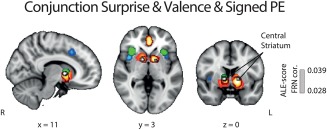
Results of the ALE conjunction analysis for all components of RPE. Overlay of brain areas individually activated by (1) valence (orange), (2) surprise (green), and (3) signed RPE (red), with p values corrected with FDR‐pN [FRN] < .05 and a minimum cluster volume of 50 mm3 for the initial maps. Importantly, the overlap between the three analyses, shown in white, also corresponds to the only cluster found for the ALE conjunction analysis between valence/surprise vs. signed RPE. MNI coordinates are given below each image [Color figure can be viewed at http://wileyonlinelibrary.com]