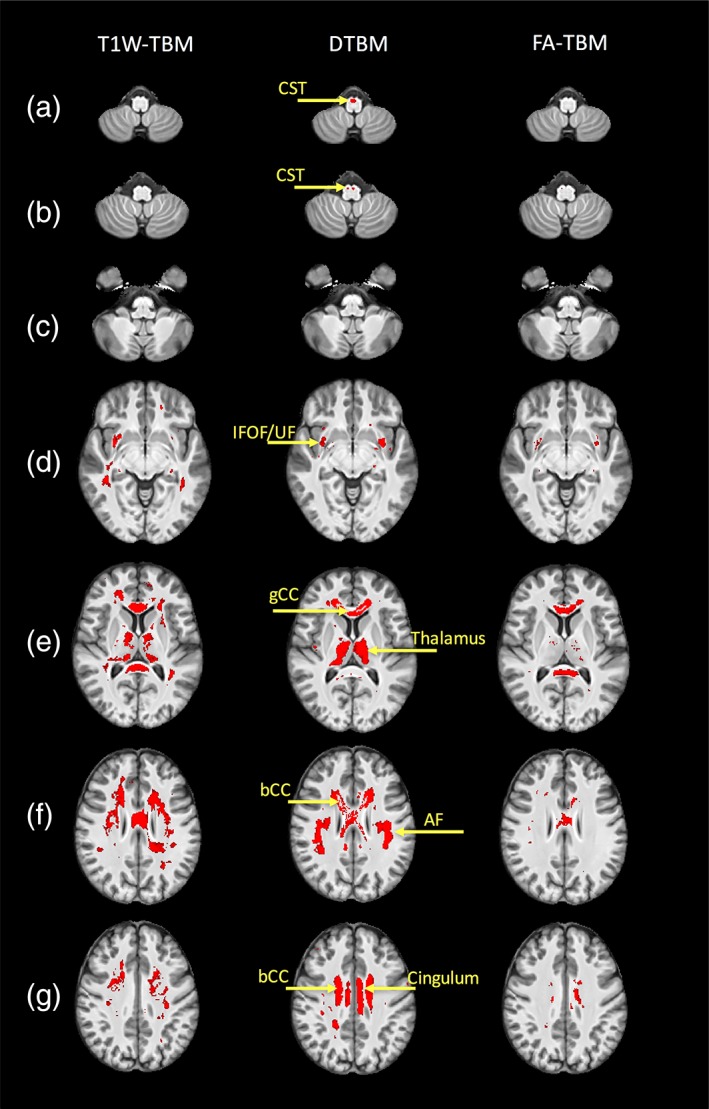
Figure 2.

Regions of statistically significant atrophy (red regions) in the SPG11 patients compared to the controls using the three different approaches: T1W–TBM (left column), DTBM (middle column), and FA–TBM (right column). Significance map is overlaid on the control T1W template. Fiber tracts that show statistically significant volumetric reduction are: AF = arcuate fasciculus; bCC = body of CC; CST = corticospinal tract; gCC = fibers from the genu of the CC; IFOF = inferior fronto‐occipital fasciculus; UF = uncinate fasciculus. The brain is presented in radiological convention with the right hemisphere on the left of the image
