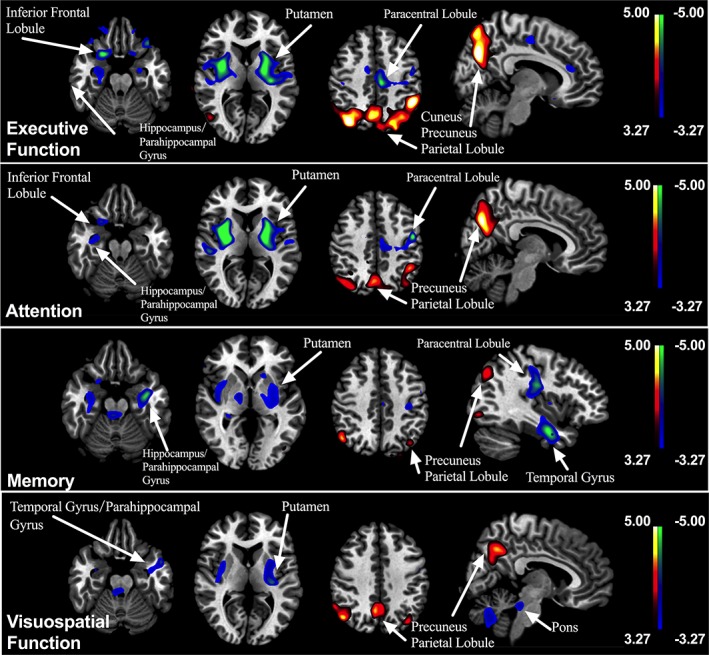
Figure 1.

Correlations between the Z‐score of cognitive domains and 18F‐FDG uptake in PD patients. Positive correlations are displayed using a red–yellow scale and negative correlations using a blue–green scale. The overlays are depicted in neurologic orientation. The gray‐scale image is the standard T1‐weighted structural magnetic resonance image (MRI) in Montreal Neurological Institute (MNI) space. The thresholds of the color bars represent T values. Voxel threshold was set at p < .001
