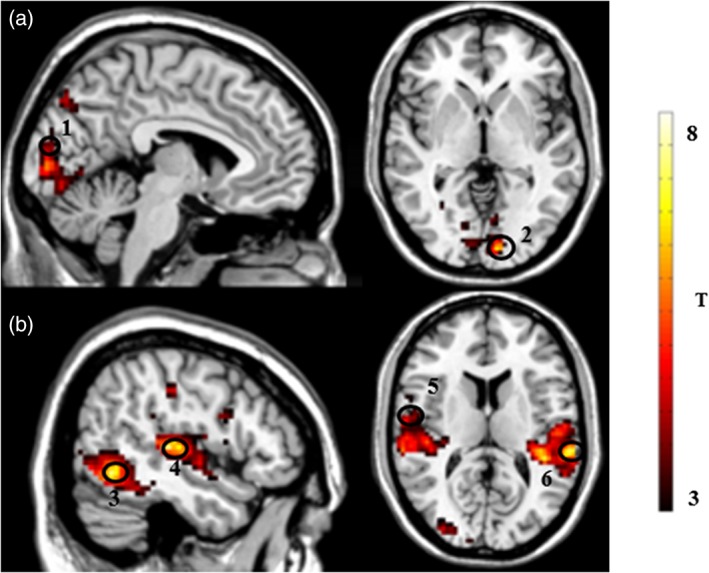
Figure 3.

Illustration of the brain regions activated during (a) the congruent (MP × MV + FP × FV) > incongruent (MP × FV + FP × MV) contrast: (1) calcarine gyrus and (2) cuneus gyrus; (b) incongruent (MP × FV + FP × MV) > congruent (MP × MV + FP × FV) contrast: (3) inferior and middle occipital gyri (4) bilateral superior temporal gyri, (5) middle temporal gyrus, and (6) supramarginal gyrus and inferior parietal lobe. T‐map thresholded at p < .001 uncorrected for multiple comparisons (3 < T < 8), superimposed on the mean anatomical image of all subjects (MNI‐space) [Color figure can be viewed at http://wileyonlinelibrary.com]
