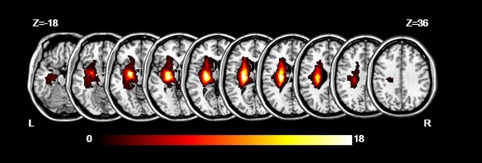
Figure 1.

The map of lesions overlapped across 33 stroke patients. The color bar indicates the number of subjects with lesions in each voxel. Z axis from Z = −18 to Z = 36 in MNI coordinates, with an incremental interval of 6. L = left; R = right [Color figure can be viewed at http://wileyonlinelibrary.com]
