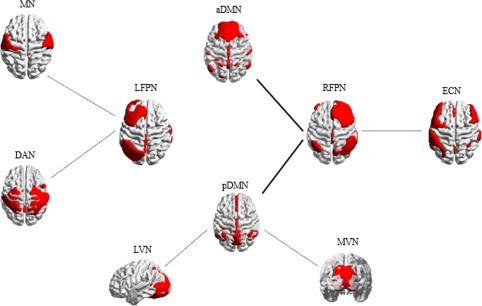
Figure 4.

Inter‐network connectivity differences between stroke patients and healthy controls. The dashed lines indicate decreased inter‐network functional connectivity in stroke patients. The solid lines denote increased connectivity in stroke patients (p < .05, uncorrected). MN = motor network; MVN = medial visual network; LVN = lateral visual network; DAN = dorsal attention network; ECN = executive control network; aDMN = anterior default mode network; pDMN = posterior default mode network; RFPN = right frontoparietal network; LFPN = left frontoparietal network [Color figure can be viewed at http://wileyonlinelibrary.com]
