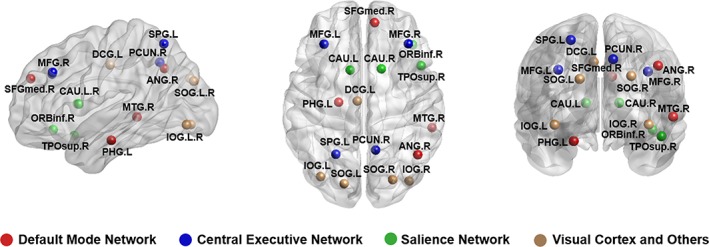
Figure 2.

Regions with significant alterations both in nodal degree and nodal efficiency in PTSD patients in comparison with trauma‐exposed non‐PTSD controls. Associations of these nodes with specific brain networks are shown in different color, default mode network (DMN; in red), central executive network (CEN; in blue), and salience network (SN; in green), and nodes not associated with these networks (in yellow) [Color figure can be viewed at http://wileyonlinelibrary.com]
