
Figure 4.
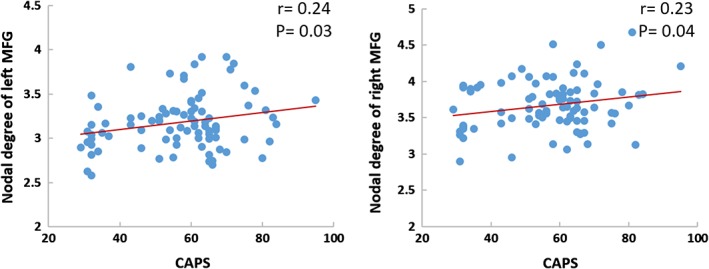
Scatterplots of the relationship between nodal topological measures and CAPS scores treating age, gender and whole brain gray matter volume as covariates in partial correlation analyses [Color figure can be viewed at http://wileyonlinelibrary.com]