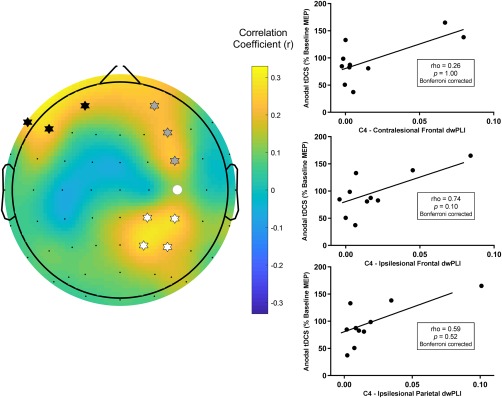
Figure 6.

Connectivity between C4, approximating the target lesioned M1, and three clusters of electrodes approximating the contralesional frontal cortex, ipsilesional frontal cortex, and ipsilesional parietal cortex in the high beta frequency band predicted response to anodal tDCS. (Left) A topographic plot of correlation coefficients from the PLS model correlating seed connectivity across whole scalp and tDCS response in high beta band. The seed electrode is shown with a filled white circle. Electrodes identified as being in a cluster approximating the contralesional frontal cortex are marked with black stars. Electrodes identified as being in a cluster approximating the ipsilesional frontal cortex are marked with grey stars. Electrodes identified as being in a cluster approximating the ipsilesional parietal cortex are marked with white stars. (Right) Mean high beta band connectivity between C4 and each cluster were not significantly associated with anodal tDCS response following correction for multiple comparisons [Color figure can be viewed at http://wileyonlinelibrary.com]
