
Figure 2.
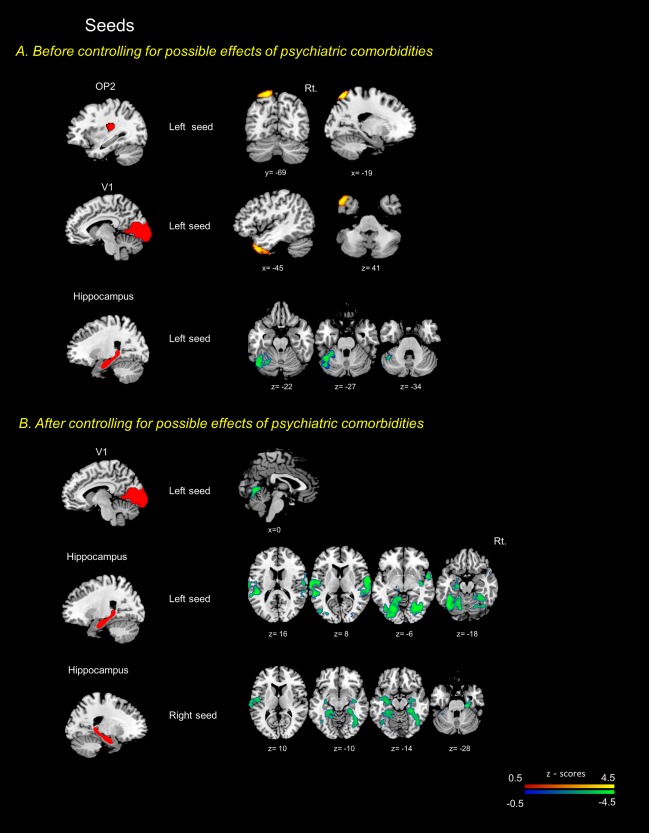
Seed to voxel analyses centered on specific brain regions associated dizziness. Seed placements are represented in the left side. The red‐yellow colored regions indicate increased functional connectivity in PPPD patients compared to healthy controls. In contrast, the blue‐green colored regions denote decreased functional connectivity in PPPD. a and b showed the results before or after excluding possible effects of psychiatric comorbidities. Cluster sized family‐wise error (FWE) corrected p < .05/number of seeds using Bonferroni correction with a cluster extent threshold of 200. The T1 template of the Montreal Neurological Institute (MNI) was used to render results. The x, y, and z values indicate the MNI coordinates of represented sections. Color bar is presented with z scores, respectively. OP2: parietal opercular cortex 2, PPPD: persistent postural perceptual dizziness, Rt.: right side