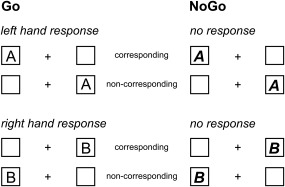
Figure 1.

Schematical illustration of the experimental paradigm showing all experimental conditions. In the left panel, “GO” trials are shown, whereas in the right panel, “NoGo” trials are shown. The upper row shows the condition requiring left hand responses on Go trials (responses on stimulus “A”), the lower row right hand responses on Go trials (responses on stimulus “B”)
