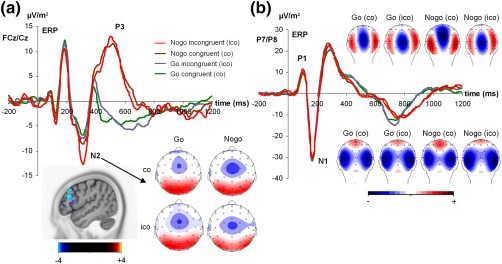
Figure 2.

(a) Event‐related potentials (ERPs) showing the N2 and P3 ERP‐component at electrodes FCz/Cz in all four experimental conditions including the scalp topography plots. The sLORETA plot shows the comparison between Go and NoGo trials in the N2 time window. The source shown is corrected for multiple comparison using SnPM (p < .01). The color scale denotes critical t values. A source in the right inferior frontal gyrus is shown. (b) The P1 and N1 ERP‐components (at electrodes P7/P8) are shown for all conditions including the scalp topography plots. The scalp topography plots show the distribution of potentials at the peak of each ERP component. In the scalp topography plots, blue colors denote negativity and red colors denote positivity [Color figure can be viewed at http://wileyonlinelibrary.com]
