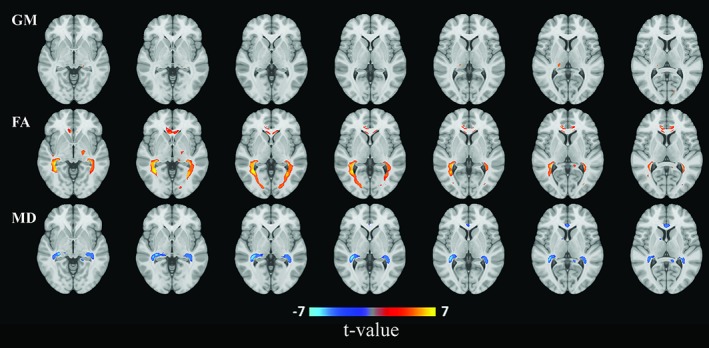
Figure 4.

Areas of gray matter (GM) density and white matter microstructure from voxel‐based analysis that were significantly associated with ganglion cell layer thickness. Colors correspond to t‐values and reflect the direction of the associations from regression models: red for a positive (increase of gray matter, fractional anisotropy (FA), or mean diffusivity (MD)), blue for a negative (decrease of GM, FA, or MD) association per standard deviation increase of ganglion cell layer thickness [Color figure can be viewed at http://wileyonlinelibrary.com]
