
Figure 2.
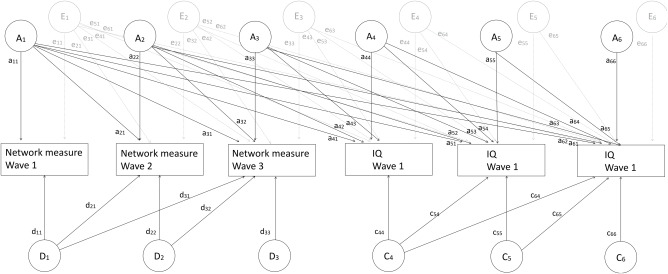
Six‐variate model to which the data were fitted. For simplicity, only the diagram for Twin 1 is shown. The additive genetic components A1 to A6 of Twin 1 are connected to those of Twin 2 with a correlation of 1 in MZ twins and 0.5 in DZ twins. The nonadditive genetic components D1 to D3 of Twin 1 are connected to those of Twin 2 with a correlation of 1 in MZ twins and 0.25 in DZ twins. The common environmental components C4 to C6 of Twin 1 are connected to those of Twin 2 with a correlation of 1 by definition for both MZ and DZ twins. For i in {1,6}, Ai represents the additive genetic factor acting on trait i. Di represents the dominant genetic factor acting on trait i. Similarly, Ci represents the common environmental factor acting on trait i and Ei represents the unique environmental factor acting on trait i. The additive and dominant genetic effects were combined to compute broad heritability of the individual traits as ( + )/( + + ) for network measure at Wave 1 and ( + + + )/( + + + + + ) for network measure at Wave 2. A phenotypic correlation between IQ and network measures at, for example, Wave 1 was defined as (a 11 × a 41 + e 11 × e 41)/√( + + ) × √( + + + + + + + + ). Furthermore, a (broad sense) genetic correlation between the broad sense genetic factors was computed as (a 11 × a 21 + d 11 × d21)/(√( + ) × √( + + + )