
Figure 5.
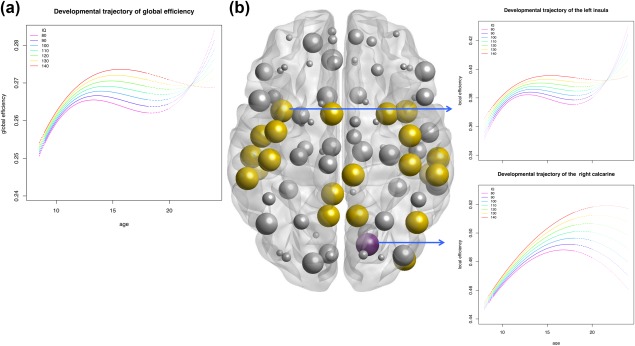
Development of efficiency depends in part on intelligence. (a) Global and (b) local FA‐weighted efficiency as a function of age and IQ. (a) Estimated age trajectories of global efficiency and its relationship with IQ. (b) Regions where IQ had a significant influence on the age trajectory of local efficiency (FDR corrected; in yellow, purple, and blue). Sizes of the spheres reflect relative p value (1 − FDR‐corrected p value). Yellow spheres indicate cubic fit; purple quadratic fit; blue a linear fit. Insets show an example of the local efficiency of the left insula and right calcarine sulcus [Color figure can be viewed at http://wileyonlinelibrary.com]