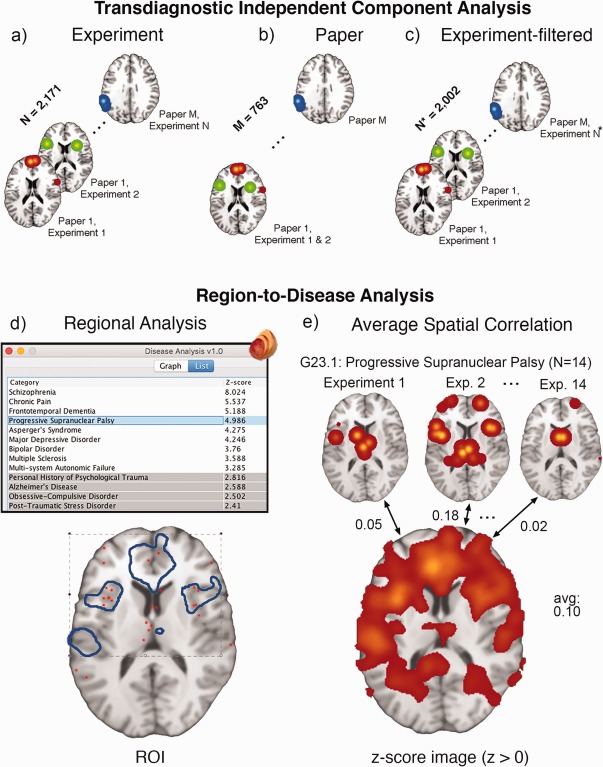
Figure 3.

Transdiagnostic ICA and reverse inference. (a) ICA input of BrainMap coordinates per experiment, along with the data‐filtering approaches of (b) Paper ICA and (c) Experiment‐filtered ICA to reduce data‐redundancy influence for large‐scale analysis. Each image shows smoothed VBM coordinates corresponding to an effective “time point” (in arbitrary order) for ICA. The bottom panel refers to separate reverse inference methods of associating an a priori (d) binary mask or (e) positive z‐score image to a disease using BrainMap's extracted coordinate data. G23.1: Progressive Supranuclear Palsy is used as an example—it contains 14 experiments in the database. The Regional Disease Analysis tool is freely available as a plugin at http://www.ric.uthscsa.edu/mango/download
