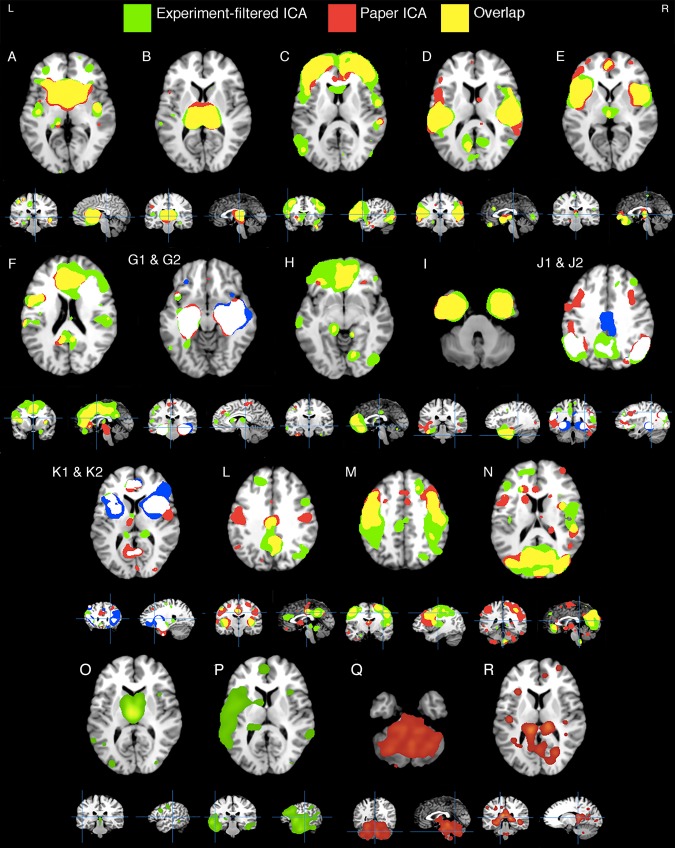
Figure 4.

VBM ICA components. Fourteen (A–N) components that showed spatial similarity (r > .4) among the separate Experiment‐filtered ICA (green) and the Paper ICA (red) methodologies. Overlap between thresholded component maps is colored yellow, while white shows overlap between a single Paper ICA component (red) and two Experiment‐filtered ICA components (green and blue). Four nonsimilar components generated from both methods are shown in the bottom (O–R). Artifact components are not displayed
