
Figure 7.
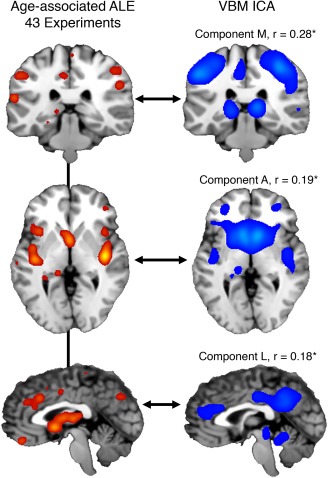
(Left column) An anatomical likelihood estimation (ALE) image was calculated from 43 experiments in healthy and diseased subjects analyzing age‐related, atrophy effects. Different rows are different views of the same ALE image (ALE value > 0.10). (Right column) VBM‐ICA components (z > 3) showing significant, voxel‐wise, whole‐brain spatial correlations corrected for multiple comparisons (p < 5 × 10⁻⁴)