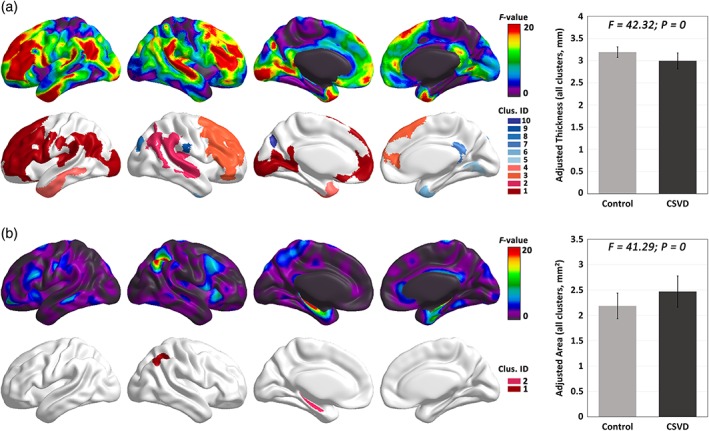
Figure 1.

The group effect on cortical thickness and surface area at the vertex level. F‐map of the group effect on cortical thickness (a) and surface area (b). Significant clusters (FWE‐corrected p < .05) are depicted with colors. The mean value across all significant clusters for each group is illustrated. Compared to control, the CSVD group showed an extensive decrease in cortical thickness and an increase in surface area [Color figure can be viewed at http://wileyonlinelibrary.com]
