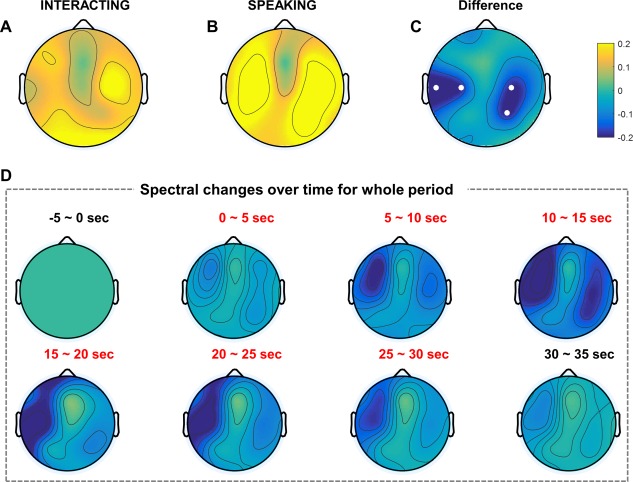
Figure 2.

EEG grand‐averaged topography in the alpha band of two tasks. Each topography indicates the normalized log power difference in the interacting (A) and speaking (B) tasks compared to baseline. (C) Topography map shows the difference between the two tasks (interacting, speaking). Small white dots represent electrodes that exhibited statistically significant differences (P < 0.05) with FDR correction. (D) EEG grand‐averaged topography of normalized power differences in the alpha band (interacting–speaking) over time. Baseline: −5–0 s; task: 0–30 s; break: 30–35 s. [Color figure can be viewed at http://wileyonlinelibrary.com]
