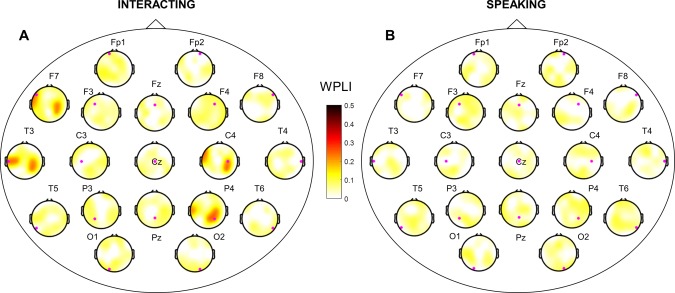
Figure 5.

Interbrain phase synchronization in EEG alpha band. WPLI for all pairs of synchronization in the two different tasks (interacting, speaking). WPLI across subjects was represented based on statistical testing (1,000 surrogate data, P < 0.05 with FDR correction). (A) and (B) are topographies of interbrain phase synchronization in the interacting and speaking tasks, respectively. Small magenta dots represent seeds from the initiator. [Color figure can be viewed at http://wileyonlinelibrary.com]
