Figure 7.

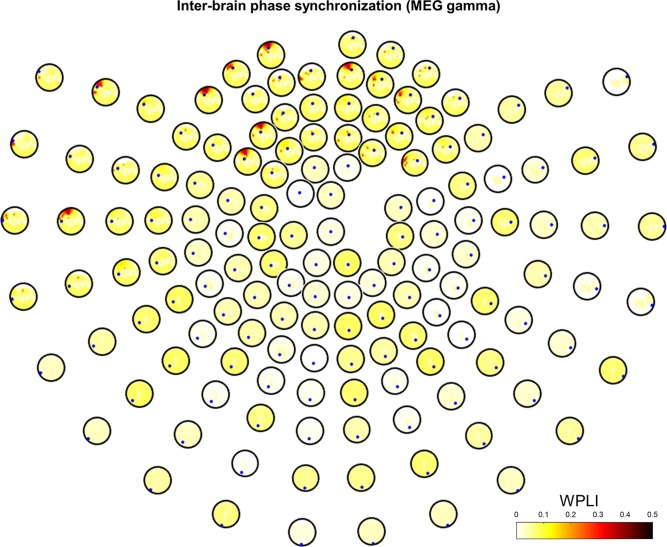
Interbrain phase synchronization in MEG gamma band. Grand‐averaged WPLI is represented based on statistical testing (1,000 surrogate data, P < 0.05 with FDR correction) in the interacting task. Small blue dots represent seeds from the initiator. [Color figure can be viewed at http://wileyonlinelibrary.com]
