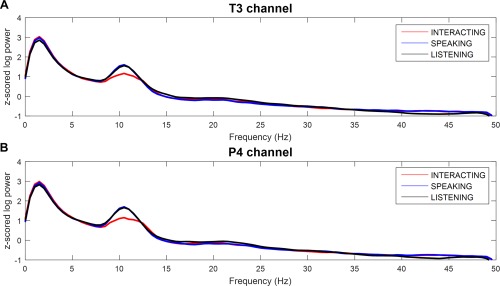
Figure 8.

Comparison of power spectral density for each conditions. (A) Left temporal (T3 channel) and (B) right centro‐parietal (P4 channel) regions in the three different tasks (interacting, speaking, and listening). Power suppression around the alpha band (8–12 Hz) was obtained in the interacting compared to the speaking and listening tasks. [Color figure can be viewed at http://wileyonlinelibrary.com]
