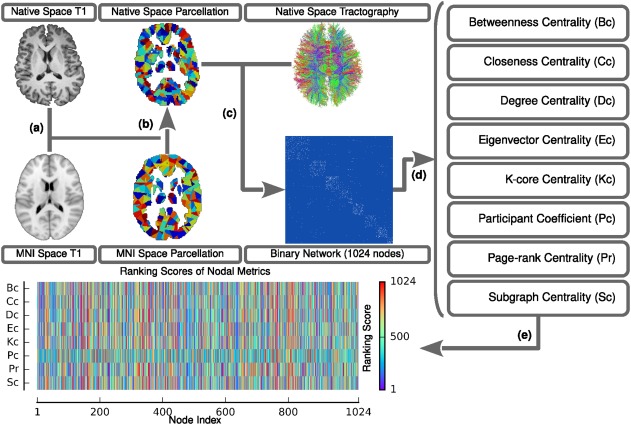
Figure 1.

Flowchart of the network construction and graph nodal metric estimation for each participant. (a) After rigidly co‐registering to the averaged b0 image, the native space T1 image was nonlinearly transformed to the ICBM 152 T1 template in the MNI space, which resulted in a transformation matrix. (b) The inversed transformation matrix was utilized to warp the parcellation from the MNI space to the native space. (c) In terms of the parcellation and the results of the deterministic tractography in the native space, the WM network was constructed. (d) Eight nodal metrics were estimated based on the individual WM networks. (e) The metrics were ultimately converted to normalized ranking scores [Color figure can be viewed at http://wileyonlinelibrary.com]
