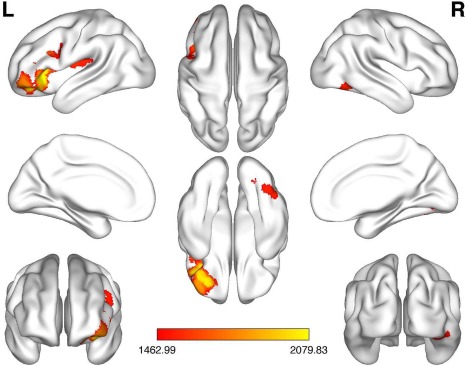
Figure 1.

Group (non‐/responders) × time (pre‐/post rTMS) interaction. Significant specific neuroplastic changes associated with response to rTMS in a cluster comprising the left dorsolateral/ventrolateral prefrontal cortex, in the left operculo‐insular cortex including the claustrum, and in the right inferior temporal cortex (P < 0.05, FWE corrected). The color bar indicates TFCE values.
FWE, familywise error; L, left; R, right; TFCE, threshold‐free cluster enhancement. [Color figure can be viewed at http://wileyonlinelibrary.com]
