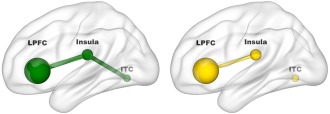
Figure 3.

Structural connectivity between gray matter regions associated with treatment response. Correlational analyses demonstrated structural connectivity between left lateral prefrontal cortex (LPFC) and operculo‐insular/claustral region (r = 0.482, P = 0.023) and between the latter and right inferior temporal cortex (ITC; r = 0.458, P = 0.032) in responders (green). Nonresponders (yellow) showed structural connectivity also between LPFC and operculo‐insular/claustral region (r = 0.373, P = 0.021) but not between the latter and right ITC (r = 0.131, P = 0.434). [Color figure can be viewed at http://wileyonlinelibrary.com]
