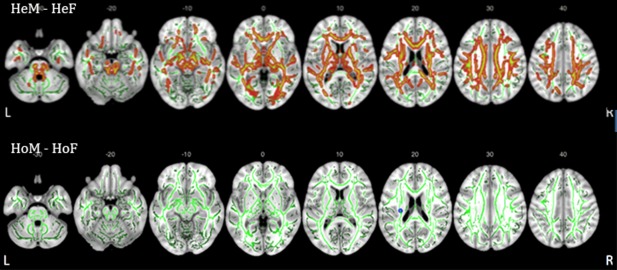
Figure 2.

Group difference in FA values. The differences are illustrated in red–yellow and blue and superimposed on the group skeleton (green). These clusters were calculated at p < .05, FWE corrected for multiple comparisons. HeM‐HeF (upper row, indicated in red–yellow) and HoM‐HoF (lower raw, indicated in blue, showing only a small cluster). z coordinates of the MNI atlas are indicated. R = right side; L = left side
