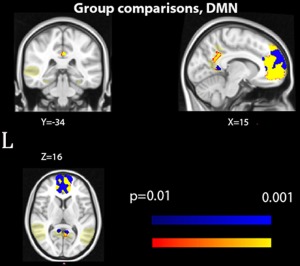
Figure 3.

Group difference, in rs‐fMRI, default mode network (DMN) significant group differences in resting‐state functional connections within the default mode network (which was also used as a mask and is indicated in pale yellow). Differences between HeF and HoF are indicated in red–yellow; the corresponding cluster for the HeM‐HoM contrast is indicated in blue. Clusters calculated at p < .01, FWE corrected. MNI coordinates for the two clusters are indicated. The Y‐coordinate for the lower precuneus cluster is −50. See also Table 4
