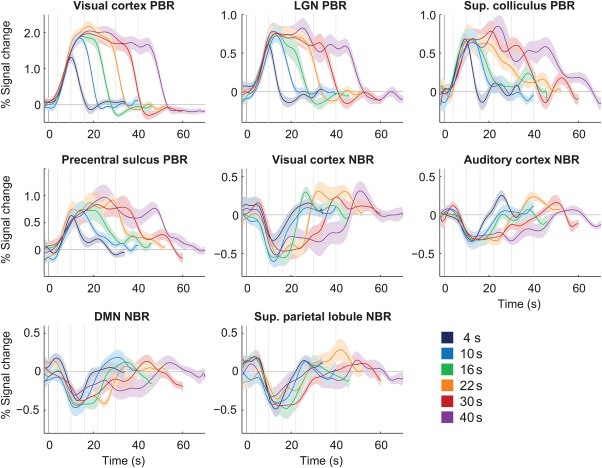
Figure 2.

Group average BOLD responses to 20%‐contrast checkerboard stimulation with varying duration (FDur), in multiple brain regions. The response curves represent average responses across subjects, with error margins representing the respective standard error; vertical lines mark the instant of stimulus cessation for each duration [Color figure can be viewed at http://wileyonlinelibrary.com]
