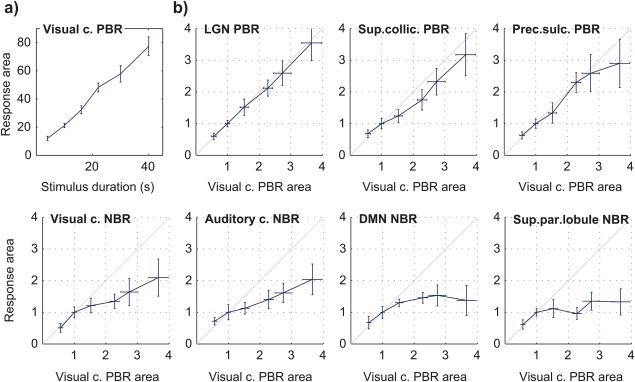
Figure 3.

Group average BOLD response durations to 20%‐contrast checkerboard stimulation with varying duration (FDur), in multiple brain regions. Each response duration was estimated as the area under the response curve. (a) Duration of the visual cortex PBR as a function of stimulus duration. (b) Response durations in the other identified regions of interest, plotted as a function of the visual cortex PBR duration, after normalization to the response area at 10 s stimulation; the diagonal grey line marks the identity function. All response durations represent averages across subjects, with error bars representing the standard error [Color figure can be viewed at http://wileyonlinelibrary.com]
