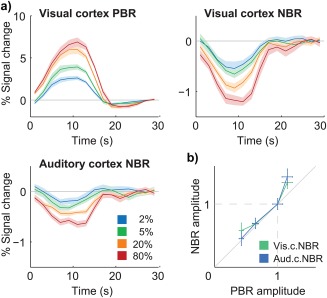
Figure 5.

Group average BOLD responses to 10 s‐checkerboard stimulation with varying contrast (FCont). (a) Visual cortex PBRs (top–left), visual cortex NBRs (top–right) and auditory cortex NBRs (bottom–right) to four increasing contrast levels. (c) Visual and auditory cortex NBR amplitude as a function of visual cortex PBR amplitude, after normalization of each response to the amplitude at 20% contrast; the diagonal grey line marks the identity function. All response curves and amplitudes represent averages across stimulation blocks and subjects, with error margins and bars representing the standard error across subjects [Color figure can be viewed at http://wileyonlinelibrary.com]
