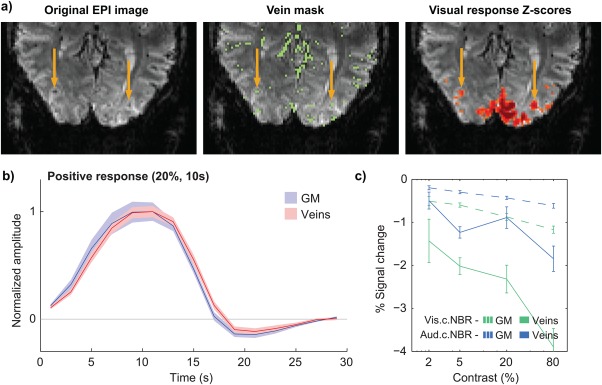
Figure 6.

The influence of large draining veins on response localization and temporal characterization. (a) GE‐EPI data from a single subject (left), the respective vein mask obtained with multiscale vessel enhancement filtering (center), and a thresholded T‐score map for the visual cortex response to the functional localizer; yellow arrows indicate two veins which are positioned in the center of activation clusters, exhibiting large Z‐scores. (b) Group average visual cortex PBRs to checkerboard stimuli of 20% contrast and 10 s duration, in grey matter (blue) and segmented vein voxels (red). (c) Group average peak amplitude of visual and auditory cortex NBRs to varying contrast level, in grey matter and in segmented veins; the horizontal axis (stimulus contrast) is presented in logarithmic scale for easier visualization. All response curves and amplitudes represent averages across stimulation blocks and subjects, with error margins and bars representing the standard error across subjects [Color figure can be viewed at http://wileyonlinelibrary.com]
