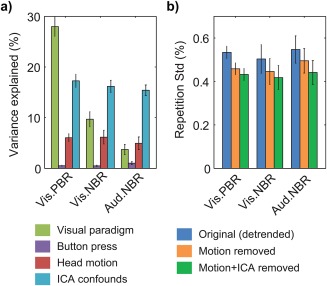
Figure 7.

The impact of the different subsets of regressors included in GLM analysis, exemplified for the functional localizer data (FLoc) in visual cortex PBR, visual cortex NBR and auditory cortex NBR regions. (a) Average percentages of data variance explained by the visual paradigm (green), button pressing to track changes in the central cross (purple), head motion (red) and ICA‐based confounds (blue). (b) Block‐by‐block response variability, expressed in % signal change, before (blue) and after removal of head motion regressors (orange) and head motion + ICA‐based confounds (green). The bars indicate averages across subjects, with error margins representing the respective standard error. The variance that remains unaccounted for is putatively attributed to residual artifact contributions, spontaneous activity and trial‐by‐trial fluctuations (Mayhew et al., 2016), and thermal noise. Low frequency (drift) contributions, as modeled within the GLM, were excluded prior to these estimations, and therefore do not contribute to the total variance or variability here presented [Color figure can be viewed at http://wileyonlinelibrary.com]
