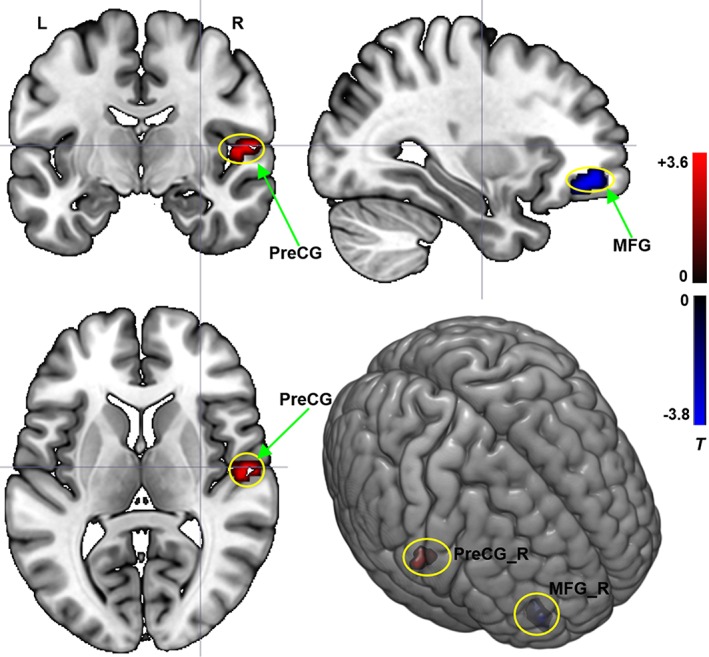
Figure 3.

Interaction effect between the frequency band (slow‐4 and slow‐5) and the group (CPH and PPH) on ReHo. Repeated‐measures anova (p < .05, corrected). T value bar is shown on the right. L = left; R = right; MFG = middle frontal gyrus; PreCG = precentral gyrus [Color figure can be viewed at http://wileyonlinelibrary.com]
