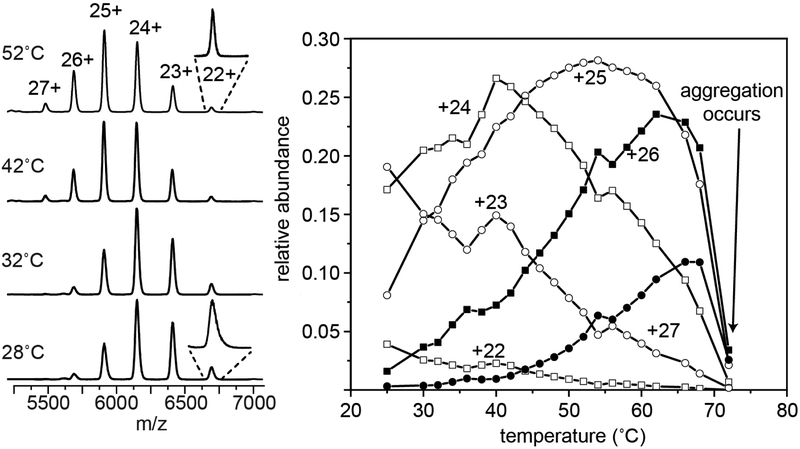
Figure 1:
Mass spectrum showing the charge state shift observed for IgG charge states 22 to 27 at 28, 32, 42, and 52 °C (left). Inset shows +22 species at 28 and 52 °C. The relative abundance plotted as a function of temperature for charge states +22, +23, +24, +25, +26 and +27. Above ~70°C spray stability is lost.

