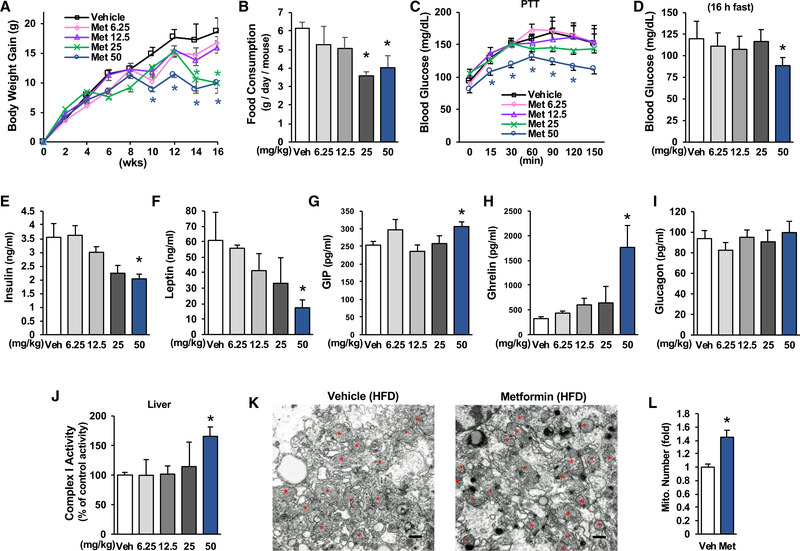
Figure 4. Metformin Improves Metabolic Parameters in HFD-Fed Mice.
HFD-fed C57BL/6 mice were divided into 5 groups and treated with indicated amounts of metformin by drinking water for 16 weeks (n = 5–8).
(A) Body weight gain of mice during 16 weeks of metformin treatment.
(B) Food consumption was measured during Comprehensive Lab Animal Monitoring System (CLAMS) (n = 4).
(C) After 9 weeks of metformin treatment, a pyruvate tolerance test was conducted (16 h fast) (n = 5–8).
(D) Fasting blood glucose (16 h fast) in mice after 12 weeks of metformin treatment.
(E–I) Serum levels of insulin (E), leptin (F), GIP (G), ghrelin (H), and glucagon (I) in mice treated with metformin for 16 weeks (n = 5–8).
(J–L) Mitochondrial complex 1 activity (J) (n = 5–8), mitochondrial numbers in the liver (K) (Scale bar, 500 nm), and relative mitochondrial density (L) in HFD-fed mice treated with metformin (50 mg/kg/day) for 16 weeks (n = 4).
Each bar represents the mean ± SEM. *p < 0.05.

