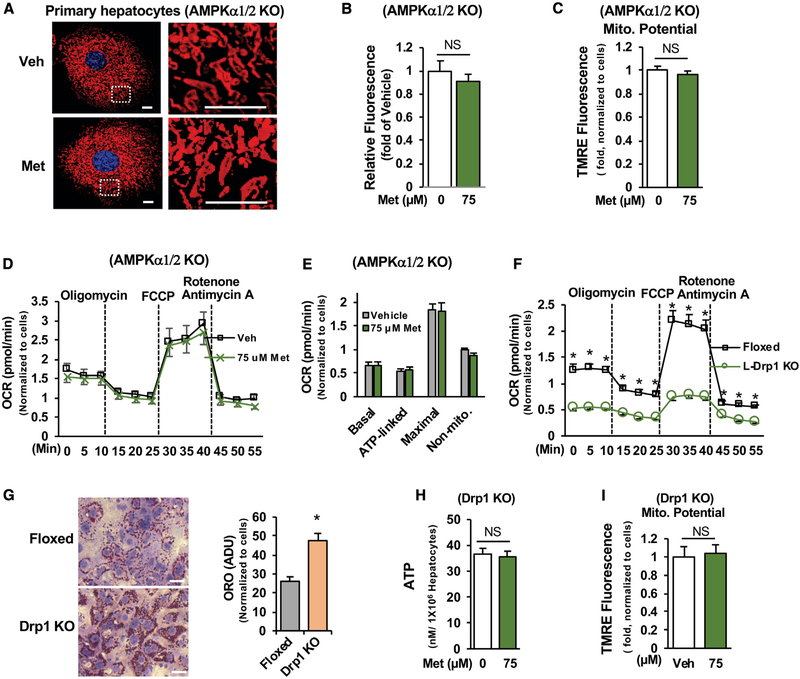
Figure 6. Metformin Stimulation of Mitochondrial Respiration Is AMPK Dependent.
(A–C) Primary hepatocytes prepared from L- α1/2 KO mice were treated with metformin as in Figure 5D (A), fluorescence intensity of 40 cells were measured (B), and mitochondrial membrane potential was determined (C) (n = 6). Scale bar, 10 μm.
(D and E) Primary hepatocytes prepared from liver-specific AMPK α1/2 KO mice were treated with vehicle and 75 μM metformin as in Figure 3D (D); OCR was determined (E) (n = 8–10).
(F) OCRs were determined in primary hepatocytes prepared from floxed or liver-specific Drp1 KO mice as above (n = 6).
(G) After 48 h of the planting, primary hepatocytes were stained with Oil Red O, and lipid droplets were measured (n = 91). Scale bar, 50 μM.
(H and I) For measurement of ATP (H) (n = 4) and membrane potential (I) (n = 8), primary hepatocytes were treated as in Figures 3B and 3C.
NS, not significant. Each bar represents the mean ± SEM. *p < 0.05.

