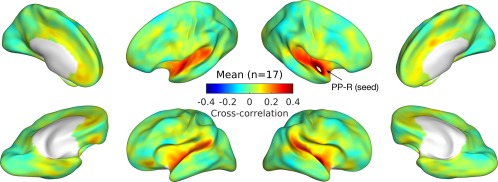
Figure 2.

Zero‐lag cross‐correlation between the right planum polare (PP‐R; the white patch marked by the arrow) and the rest of the cortex are averaged across all individuals (n = 17). Correlations are projected onto minimally inflated cortical surfaces, which show major anatomical landmarks such as the Sylvian fissure. [Color figure can be viewed at http://wileyonlinelibrary.com]
