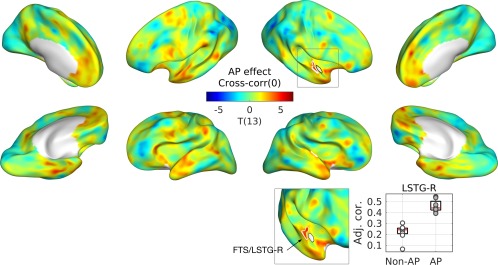
Figure 3.

Group difference between musicians with and without AP in zero‐lag cross‐correlation. T‐statistic maps are projected onto semi‐inflated cortical surfaces. Significant clusters are indicated by white contours. T‐statistic maps are projected onto semi‐inflated cortical surfaces. Significant clusters are indicated by white contours. In an inset (upper right), a zoomed view from a different angle is given to show the cluster in the medial part of the supratemporal plane more clearly. A boxplot with regression lines (lower right) is given for the peak of the cluster. An open circle represents a musician without AP, and a gray circle represents a musician with AP. Abbreviations: Adj. Cor., correlation coefficient adjusted for the nuisance variables of ethnicity and head motion; FTS, first transverse sulcus; LSTG, lateral superior temporal gyrus. [Color figure can be viewed at http://wileyonlinelibrary.com]
